Operational Analytics for Supabase-Backed Products
Supabase teams can skip the warehouse by governing metrics on Postgres.
Operational analytics for Supabase-backed products can run without a separate warehouse. It requires a healthy Postgres instance and a single metric definition layer that serves governed datasets to humans and AI agents. For teams that want full API control without an opinionated frontend, headless analytics provides the appropriate architecture, separating metric definitions from the dashboards, reports, and agent workflows that consume them.
Why Supabase products already have an analytics problem before they think they do
Auth, storage, edge-function calls, and user behavior in a Supabase product are built on a single Postgres core. That database is both the operational system and the closest available analytical source of truth. The raw material is already in place. Teams can use it for serious operational analytics, provided they instrument the database and model its data correctly.
The same concentration also creates operational risk. As users scale, missing observability makes failures progressively harder to diagnose because product behavior and database performance depend on the same system. By the time the team spots slow queries or failed connections, an early warning may have grown into a production crisis.
What "operational analytics" actually means for a Supabase-backed product
Operational analytics means continuous visibility into the health, performance, and business behavior of a running product, using the Postgres instance that powers it. The focus is the product in operation. Unlike general BI or warehouse-style reporting, it connects what users are doing with the condition of the system serving them.
The signals fall into two complementary categories. Infrastructure signals include connection pool saturation, cache hit ratio, query performance, CPU and memory utilization, disk I/O, and replication lag. Business signals include auth events, user behavior records, storage operations, and API call patterns. One category describes database health, while the other describes how the product works for users.
Supabase's Metrics API documentation identifies the problem with separating those views. Siloed database metrics prevent teams from correlating API latency spikes with connection saturation or overlaying query performance against deployment events. Supabase Observability supplies several parts of this combined view, including logs queryable via SQL and ClickHouse, a Prometheus-compatible Metrics API, and live Postgres stats. Security and Performance Advisors add diagnostic findings, while Reports dashboards span API, Auth, Storage, Realtime, and database signals.
The Postgres hygiene failures that make analytics unreliable before you even start modeling
Connection saturation collapses query throughput and can make apparent query latency misleading. Queries may be slow because no connections are available. The signal is a connection count approaching or reaching max_connections. The interventions are transaction pooling through Supavisor or PgBouncer on paid plans, reducing max_connections, and checking application code for connection leaks. The Metrics API guidance calls for saturation alerts before pools fill up, giving teams minutes to look into the cause before connections fail.
Slow, unpredictable reads also distort latency-based business metrics. A falling cache hit ratio shows that queries are reaching disk instead of memory, so teams can see the slowdown before users notice it. Teams should instrument it early and monitor whether the ratio stays at or above a very high threshold.
Unindexed query patterns become production bottlenecks as tables grow. Sequential scans on large tables can inflate execution time non-linearly, even when the same query performed acceptably at launch. EXPLAIN ANALYZE exposes those scan patterns. Teams can add indexes on filtered columns, select only the columns they need, use pagination, and replace N+1 patterns with joins or batch operations.
CPU and memory alerts should fire before utilization stays above a high threshold, giving teams time to upgrade before users notice a slowdown. Supabase Advisors adds security and performance findings available through Studio, the CLI, MCP, or the API. Those access paths let diagnostics feed automated monitoring as well as a dashboard.
Why metrics drift is the silent killer of analytics credibility for early-stage teams
An investor asks for audited revenue, but the board deck does not match the product dashboard, and the growth spreadsheet contradicts engineering's report. The database may be perfectly healthy throughout. The discrepancy begins when separate queries use semantically similar but numerically different columns. Each query looks sound on its own, but each answers a slightly different question under the same metric name.
This is an architectural failure. Without a single governed definition, every analyst, engineer, and reporting tool becomes another place where business logic can diverge. Infrastructure observability protects database health, but it cannot establish what revenue, churn, or an active user means.
The structural response starts with a data dictionary in which every metric has one agreed definition. For an early-stage B2B SaaS team, the practical scope is a small set of actionable KPIs, including CAC, LTV, monthly churn, ARR, and gross margin. Their definitions should be locked before the team adds more. That shared vocabulary is the prerequisite for an analytics layer that produces consistent answers, whether the consumer is preparing an investor report or answering through an agent.
What a semantic layer built on Postgres actually solves, and what it does not
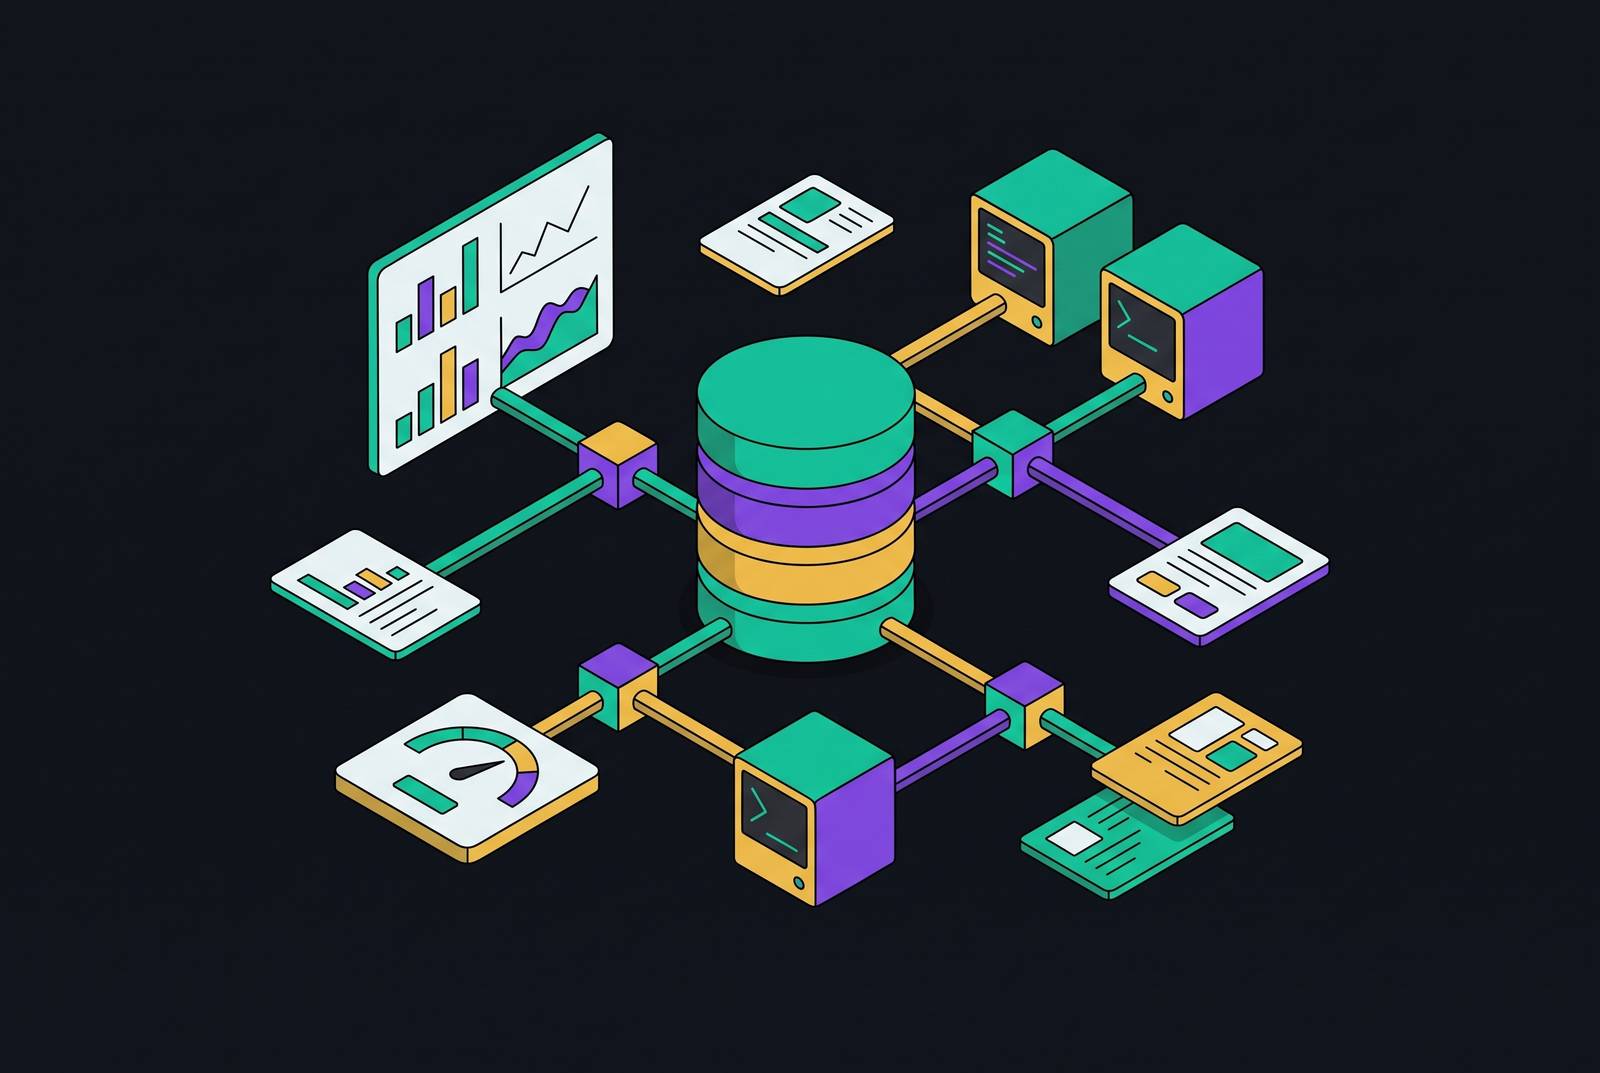
A semantic layer puts agreed business definitions into code and gives the same definitions to everyone who uses them. Dashboards, investor reports, growth spreadsheets, and AI agents query the same pre-modeled definition. A change to monthly active users then propagates to every tool consuming that definition.
That shared layer also supports cross-signal analysis. Infrastructure and business signals can be composed to examine latency against conversion or connection saturation against churn. An agent receives the same metric as an analyst because neither needs to invent the calculation at query time. The useful unit of access is a pre-modeled, pre-calculated dataset, rather than an arbitrary query whose logic changes with each request.
The guarantees stop at the layer's boundaries. It does not clean bad source data, so wrong inputs can still give the same wrong outputs each time. It does not repair a saturated or poorly indexed database, whose performance problems remain underneath it. Nor does a governed metric definition make agent access safe by itself. Stable, auditable datasets reduce the variability of query-based access, but the surrounding platform still needs controls over identity, exposure, performance, and use.
Why letting AI agents query production Postgres directly is a structural mistake
An agent asked for monthly churn can produce a different answer from an analyst if it constructs its own calculation against raw tables. Structured access does not establish shared meaning. MCP standardizes how agents call tools and access resources, but it does not clean, transform, or govern the data they consume. The governance layer must therefore exist before MCP exposes it.
An agent's exploratory queries consume the same production resources as application traffic and can contribute to connection saturation. With read-only permissions, an agent's queries still compete with application traffic for production resources, and an agent that can read private data and is exposed to prompt injection can disclose private information through the response text.
The recommended setup keeps raw production data out of the agent's reach and sends its requests through the governed layer that people use. Production database credentials should never be put in agent configuration. Access through a gateway, read replicas for analytical queries, and least-privilege service accounts help keep that separation safe. Identity, semantic grounding, query performance, lineage, cost controls, and auditability belong in the underlying platform. MCP is the interface to those capabilities.
How Supabase's native observability tooling composes with an agentic monitoring setup
Supabase provides supported interfaces for repeatable, read-only infrastructure diagnostics without giving an agent direct production database access. Logs help teams look into problems, live Postgres stats show how the database is doing now, and Advisors gives them security and performance findings. Reports provides a human-facing view across product services, while programmatic interfaces let diagnostic workflows consume the relevant signals.
For hosted projects, the Metrics API emits Prometheus-compatible telemetry covering CPU, memory, disk I/O, WAL statistics, connection pool metrics, and query performance. Datadog can consume that telemetry within an observability stack. AWS Managed Prometheus provides a managed Prometheus backend, while self-hosted Prometheus supports teams operating their own collector. These are telemetry backend choices. Their shared compatibility makes database health signals portable enough to compose with the governed analytics layer.
Self-hosted Supabase requires a different operational consideration. The Metrics API is available only on hosted projects. As of the week of June 1, 2026, the analytics service, Logflare, and the vector service moved from the default docker-compose.yml into an opt-in overlay file. Self-hosted teams needing Logs Explorer in Studio must explicitly include that overlay in their Docker Compose invocation. The base stack runs leaner without it, but the logging interface now requires that configuration choice.
What metrics should be pushed to where people work, not pulled on demand
A dashboard that requires deliberate consultation makes visibility depend on someone remembering to open it. That is an unreliable basis for operational decisions. Humans consult tools inconsistently, and agent workflows also need a defined occasion to check. A governed metric becomes useful in daily work when its delivery no longer depends on an unprompted visit.
The push model calculates metrics ahead of time and delivers them to Slack, email, or a shared inbox on a defined cadence. Daily revenue, weekly churn, and hourly connection saturation provide different rhythms for different decisions. A founder reading Slack and an agent running a monitoring prompt can consume the same pre-calculated result.
This is where headless analytics has a concrete advantage. Data infrastructure decoupled from a single frontend and accessible through MCP or an API can serve a digest, an investor report, and an agent's hourly check without duplicating metric logic or recalculating it independently. Adding usage analytics to an AI agent can therefore work without a prebuilt dashboard UI. It requires access to governed usage datasets and a workflow that consults them. The delivery surface can change without changing the metric.
What a Supabase team without a data hire can realistically build and where to get help
A small Supabase team can own much of this foundation without a dedicated data hire. Connection pooling, indexing, and cache hit ratio monitoring are jobs for engineers and do not need data science. Founders can own a short KPI list and its agreed definitions before buying any analytics tooling. Native observability requires configuration. The distinction is between work the team can reasonably absorb and work that demands a specialized modeling layer.
That distinction is financially significant at seed or Series A. A credible first data team of three people costs a lot in annual base salary, even before benefits, tooling, or leadership. Building every component internally is therefore not the only realistic route. Outside help lets a team do more when it pre-models business metrics into governed, pre-calculated datasets or connects those datasets to agent workflows without exposing production credentials.
For teams choosing a partner or purpose-built platform, the relevant criteria are Supabase-specific instrumentation, a single metric definition layer, raw API access, and safe MCP integration without a mandatory frontend. A fractional partner can supply architectural knowledge faster than an engineering team building from scratch. But that knowledge may stay with the vendor. Teams should plan to bring core metric definitions in-house as data becomes central to the business, so that the meaning of their numbers does not leave when an engagement ends.