What Headless Analytics Means for API-First Teams
Define MRR and churn once, then reuse them everywhere.

Headless analytics gives API-first teams one layer in which to define metrics, separate from the interfaces that show the numbers. For SaaS teams using Supabase, that means defining MRR, churn, activation, and conversion rate once, then reusing those definitions across dashboards, reports, product interfaces, and AI agents. Consistency comes from governing the metric before any consumer queries it.
Why API-first teams end up with broken metrics even when their infrastructure is solid
An executive meeting reaches the revenue discussion, and two different numbers appear. Sales, finance, and product bring their own ARR calculations, so the talk shifts from making the decision to choosing which calculation to trust. The infrastructure can be sound while this happens. A Supabase or Postgres team may version-control its schema, ship authentication through an SDK, and manage feature flags through an API, yet calculate revenue differently across its reporting surfaces.
The cause is architectural before it is technical. One engineer writes SUM(revenue), another writes SUM(amount_captured), and each calculation ends up built into a different tool. Neither a reliable database nor a polished dashboard resolves the difference in meaning. Platforms like Dreambase address this problem by creating a governed data layer for Supabase and Postgres teams, where revenue and ARR belong to the shared layer.
In traditional BI, the metric model often lives inside the reporting platform. Looker metrics are primarily defined in Looker, although exposed externally through JDBC and MCP, while Power BI models are accessible through XMLA endpoints. Consumers built apart from one another can access those models, but that access alone does not give them a shared definition. When a product interface, Slack alert, and chatbot each recreate the calculation, drift remains part of the architecture.
What headless analytics actually is, and what it is not
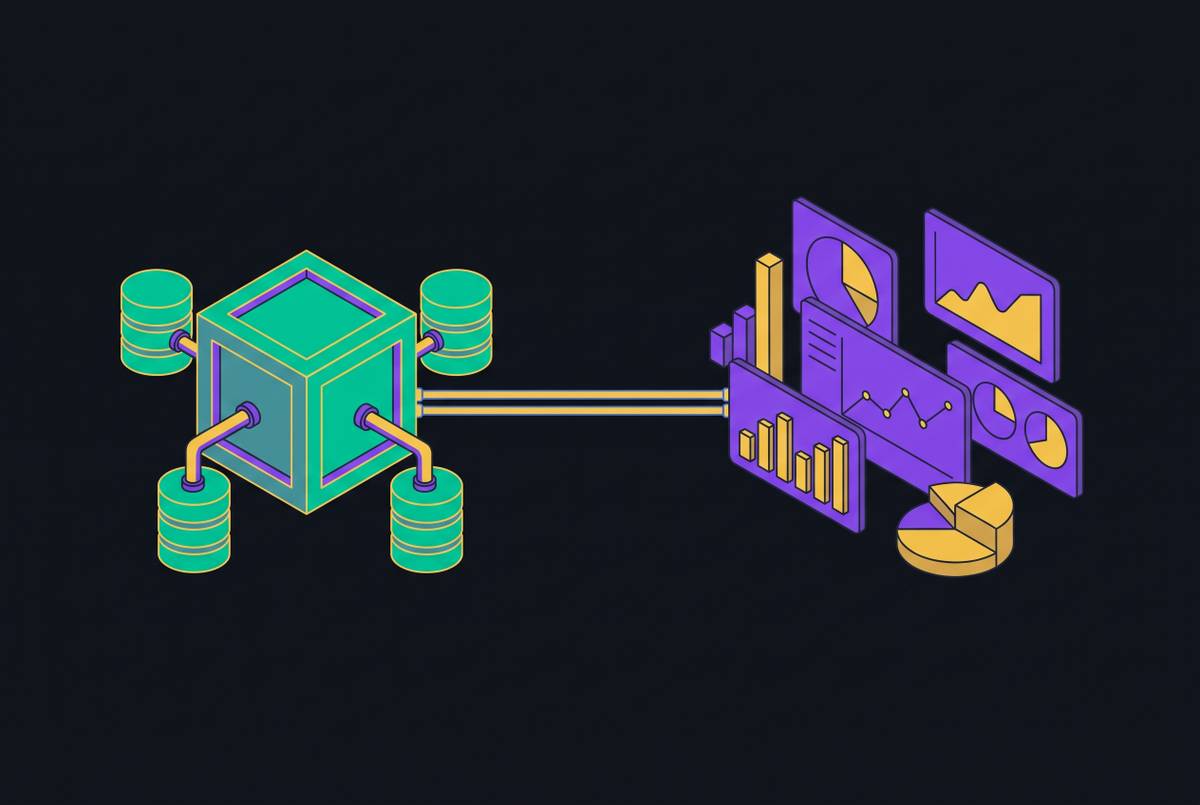
Headless analytics is an architectural pattern that separates metrics and business logic from presentation. A semantic layer defines what the data means, an API layer makes those definitions queryable, and access control determines what each consumer may see. The dashboard is a client of this system. The analogy to a headless CMS is direct but limited. Content management is separated from rendering in one case, while analytics logic is separated from visualization in the other.
The reusable part sits between raw data and the front end. It handles semantic definitions, query generation, caching, and API exposure, so consumers request governed answers. An executive dashboard and an analytics tab for customers can then use the same metric while each has its own visual interface. A Slack bot or reverse ETL pipeline can query that metric without adopting a dashboard at all. What a consumer can access still depends on its permissions.
An endpoint that returns chart data is not sufficient. A complete implementation needs the semantic layer, access control, and caching behind that endpoint. The distinction between a metric store and headless BI is largely one of emphasis. The former puts the focus on the definitions, while the latter puts it on how many consumers can use them through APIs. In both, the foundation stays in place when the tool used to show the data changes.
Why this pattern fits API-first teams specifically, and why traditional BI integration does not
For API-first engineers, the important question is how analytics enters the software delivery process. Authentication, filters, and embedding logic need to live in version control and move through CI/CD rather than depend on manual configuration in a separate interface. Code-defined integration can follow the same path as other application features, including automated testing and promotion from development to staging to production.
The traditional embedding workflow puts a different boundary around the work. An analyst builds a dashboard, a developer embeds it through an iframe, and a designer tries to fit that surface into the product. Customization is constrained by the embedded interface. With API-first analytics, the analyst can work on definitions while backend engineers manage integration and frontend developers render results in their own React components. The shared contract is the governed data.
The practical test is whether authentication, embedding, and user context can be controlled entirely through the SDK. A mandatory UI step leaves part of the integration outside the programmable workflow. This matters most when dashboards must be provisioned through an automated workflow for hundreds of customers. Headless analytics that consumers can access through REST APIs and MCP meets that need because they can use the data layer without having to integrate through a proprietary interface.
How do Supabase teams define metrics once and reuse them across every report
The semantic layer defines what the database structure means for the business. Without it, an API consumer still needs to understand the tables, relationships, and filters behind a number. A semantic layer can turn orders.sum(total_price) WHERE fulfillment_status = 'fulfilled' into a queryable metric called “Fulfilled Revenue”. Applications then reference the metric. This is the mechanism behind defining once and querying everywhere.
That mechanism only works when the business meaning is explicit. Marketing may call someone an active customer because they opened an email recently, finance because they purchased within the past year, and product because they logged in within the past month. A shared model makes the distinction visible instead of allowing every department to present its calculation as interchangeable. The aim is one authoritative foundation of measures, filters, and dimensions that accommodates different legitimate business questions.
For Supabase teams whose analysts and other report consumers calculate conversion rate differently, the repair is therefore in the definition layer. The agreed formula and its filters must become the shared metric that both consumers query. The same principle applies to MRR, churn, and activation. Their meaning should not change because a report moved from an analyst’s dashboard to a product manager’s interface.
Mechanically, metric definitions, dimension hierarchies, table relationships, and business logic live in code, typically YAML or JSON. That makes them versionable, testable, and auditable. The dbt Semantic Layer describes its role as allowing teams to “define metrics and use various interfaces to query them”. It also generates the SQL needed to locate and join the relevant data. Consumers reuse the business definition while the semantic layer handles its translation into a query.
Why AI agents querying data alongside humans make governed metrics non-negotiable, not nice-to-have
An agent can generate SQL against production tables that looks plausible but omits business logic a human analyst would apply. The resulting number can then enter reports, alerts, and automated decisions with apparent authority. A discrepancy that might interrupt a meeting can instead propagate through an automated workflow. Governed metrics constrain what the agent can interpret as an authoritative business answer.
MCP provides a connection standard. Model Context Protocol, first developed by Anthropic and now governed by the Agentic AI Foundation under the Linux Foundation, sets out how AI systems talk to external tools and data repositories. It separates the AI client, the MCP server’s connector logic, and the underlying resource. That separation allows an agent to access a governed API. It does not itself clean data, define revenue, or enforce a business model.
A safe way to start is with a read-only resource server that exposes data that has been reviewed, then add write actions later under change approvals. User context must also constrain what the agent can retrieve. A semantic layer can accept a JWT and scope results to the user’s permissions, so access to a metric does not imply access to every row behind it. Supabase RLS belongs at the database boundary. The important distinction is between controlling what an interface displays and enforcing what a consumer may query.
Dreambase implements one version of governed MCP access by modeling data into Parquet datasets queryable through DuckDB and exposing them through a single MCP server. With that modeled-dataset path, agents query the analytical layer, keeping their queries isolated from production tables. Its Supabase integration also describes queries against live Postgres, so production isolation cannot be assumed for every integration path. The relevant criterion is the resource an agent actually reaches.
What running analytics as a data layer rather than a dashboard product actually looks like in practice
In operation, the dashboard stops being the system of record. Metric definitions, governance, and access controls are separate from every front end. An MRR definition can support an executive dashboard, a customer-facing analytics tab, and a Slack alert triggered by a threshold. An agent that answers a founder’s question about cohort retention uses that same governed layer. Each surface has its own job, but none needs its own version of the business logic.
This architecture also changes what an agentic interface can reasonably claim. Zenlytic’s Zoë validates generated queries against a governed semantic model and returns citations identifying the source tables, filters, and field definitions used. The governing principle is that a fluent response still needs a traceable definition underneath it.
That principle requires operational guardrails. AI outputs should be limited to reviewed metrics and dimensions in a curated semantic layer. Logging should cover the natural-language prompt, generated SQL, resulting chart, and a sampled faithfulness score against the underlying data. Drift should trigger alerts, and auto-publishing should remain blocked until a measured accuracy floor is established. These controls address whether the generated output faithfully represents the governed data, rather than treating successful query execution as proof of correctness.
For Supabase and Postgres teams, implementations such as Dreambase combine governed datasets, pre-calculated metrics, live dashboards, and AI-generated reports in a shared layer for people and agents. This can extend an existing project without a separate warehouse or schema changes. Even without an ETL requirement, there can be an intermediate form of the data for analysis, as the Parquet path shows. The operational change is that metrics can be prepared and pushed to where people work instead of recalculated independently whenever someone opens a reporting tool.
How a Supabase team moves from ad-hoc queries to a governed data layer without a data engineering project
A governed data layer can be built without a data team, a warehouse migration, or months of setup. For a small Supabase team, the simplest version that works starts with choosing what the metrics mean and who owns them. The first step is to choose five or fewer actionable KPIs and agree on one formula for each. For most B2B SaaS teams, the starting set is CAC, LTV, monthly churn, ARR, and gross margin. Finance and marketing need to agree on those formulas before another interface makes their differences harder to unwind.
The second step is to connect the sources that supply those definitions. These may include the CRM, commerce platform, analytics, ad platforms, and finance systems. With prebuilt connectors, this can be a configuration task. The important constraint is that each source feeds the shared metric definition.
The third step is to put governance in the layer. ARR should reconcile to the billing system, cash to the bank, and product usage to the analytics layer. Both applications that people use and agents should then be able to access those governed metrics through an API or MCP server. Tool selection follows from these requirements, including connectors for the actual stack, centralized definitions, role-based permissions, and an agent query path that does not expose production tables. Permissions should not require custom RLS work for every new consumer.
For this stack, Dreambase is an option that extends Supabase without ETL or schema changes and offers modeled datasets through MCP. A founder’s morning dashboard and the team’s first AI agent can consume the same governed metrics, with reports delivered through the surfaces where the team works. That is headless analytics done properly for a small API-first team, with one definition layer serving many consumers instead of every consumer inventing its own numbers.