How the Model Context Protocol Routes Agent Analytics Queries Through a Governed Metrics Server Instead of Supabase Directly
To give AI agents governed access to Supabase data through the Model Context Protocol, use a governed metrics server. The agent calls named tools that use pre-modeled, pre-calculated metrics, and it cannot get the production credentials. This architecture separates analytics from transactional workloads and makes business definitions repeatable across dashboards and agent workflows.
What MCP actually does and what it deliberately leaves unresolved
MCP defines how agents connect to systems. It does not check whether those systems return accurate metrics, limit permissions to what agents should be allowed to do, or protect production workloads. Like HTTP, it is a specification rather than a product with a license to buy or a package that alone solves the architecture. Its value depends on what sits at either end of the connection.
That distinction leaves an important decision to the team exposing tools. When an agent can call a server through a standard interface, what prevents it from calling the wrong one? The protocol does not answer that question. Governance comes from the server’s permissions, the operations it exposes, and the definitions behind its results. A raw database interface and a governed metrics interface can both use MCP while giving the agent very different powers.
What happens when agents reach Supabase directly
Cold reporting queries that join large tables compete with application traffic for the same connection pool and I/O budget. Row-level security policies that query related tables can add to the load when a subquery runs for every row in a large result set. An agent that repeats an aggregation on demand adds work and may not know that the same calculation ran five minutes earlier. These workload conflicts leave Supabase suitable as the operational database.
The security risk follows a different path. Agents can treat tool descriptions, parameter schemas, and returned data as trustworthy instructions, even when that content should not control their behavior. A Supabase/Cursor integration incident involved integration tokens being exfiltrated to a public thread through prompt injection exploiting excessive MCP access. No privilege escalation occurred, and no permissions were violated. The agent already held overly broad service_role credentials, so the failure was the scope of authorized access.
An agent can chain individually permitted queries to reconstruct an aggregate that no single query would expose, a pattern that row-level security alone cannot catch. MCP servers may also hold credentials for several systems, increasing the consequences of broad scope. Limiting writes prevents one kind of damage, but a read that is allowed can still be unsafe for analytics.
Metric inconsistency is equally consequential, even when access is legitimate. An agent calculating monthly active users from raw event rows may produce a result that differs from the investor report or product dashboard. The query can run successfully while using the wrong business definition. RLS controls access at the row level. It also does not, by itself, provide a record of what the agent asked and what it received. Supabase is still the source of operational truth, but agents need a better interface than raw tables for governed analytics.
How do you let agents query Supabase data without direct database access?
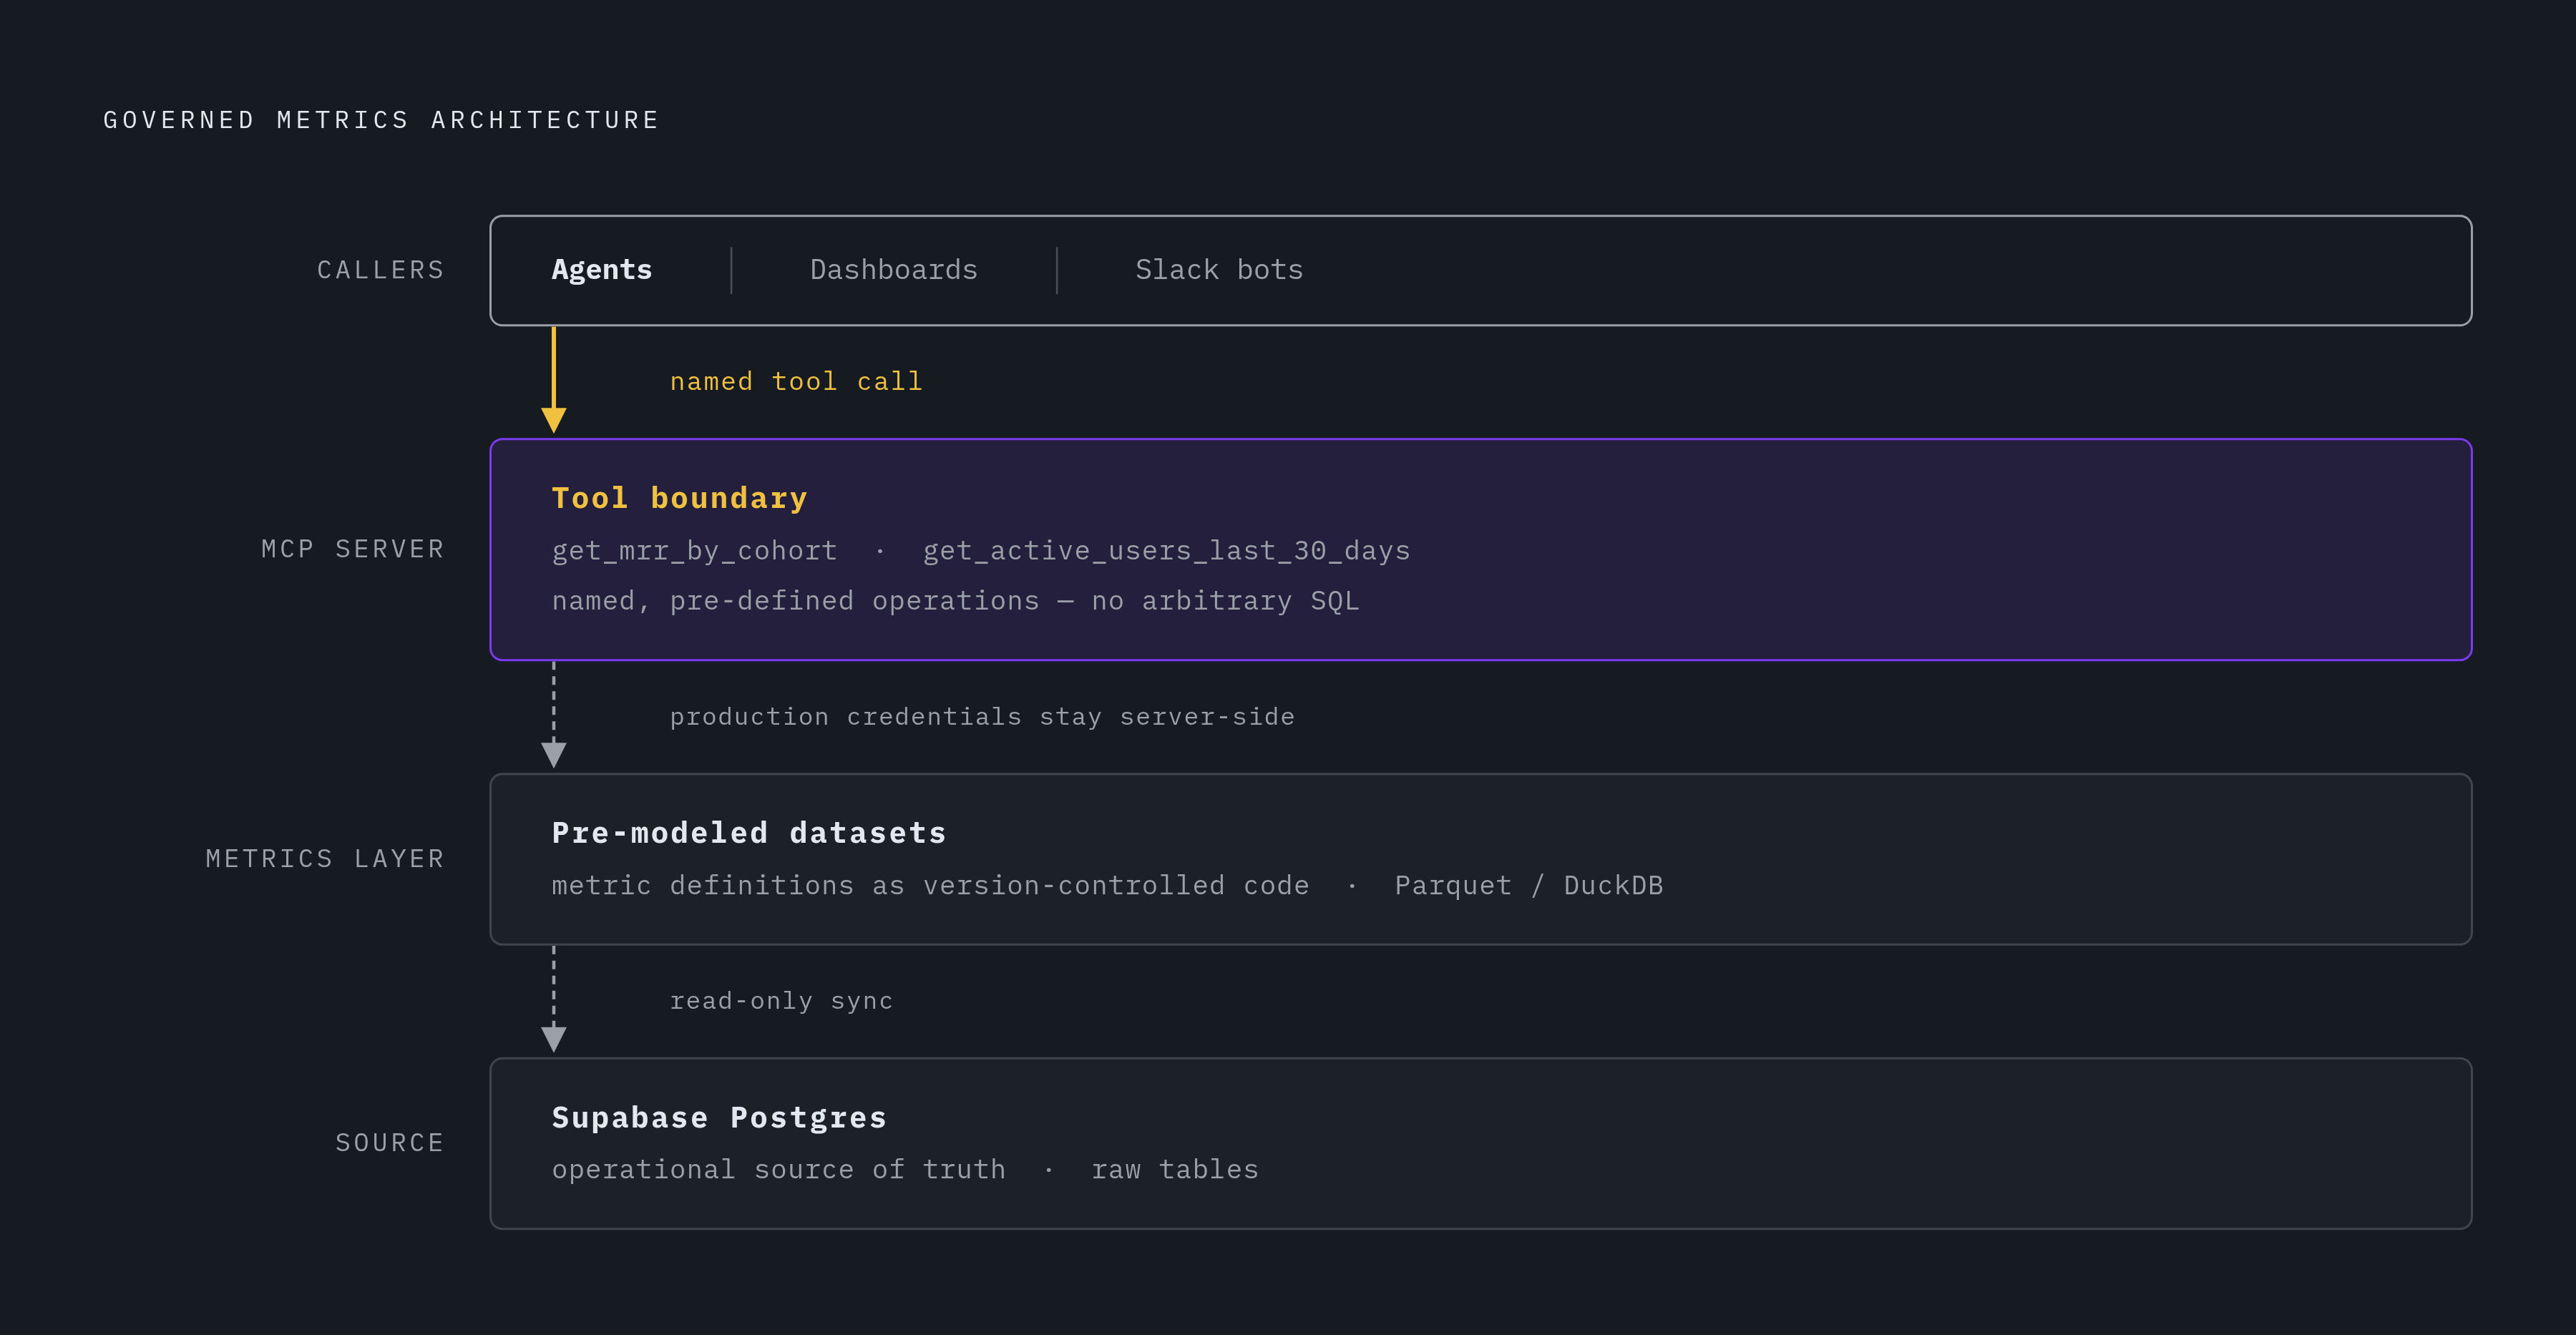
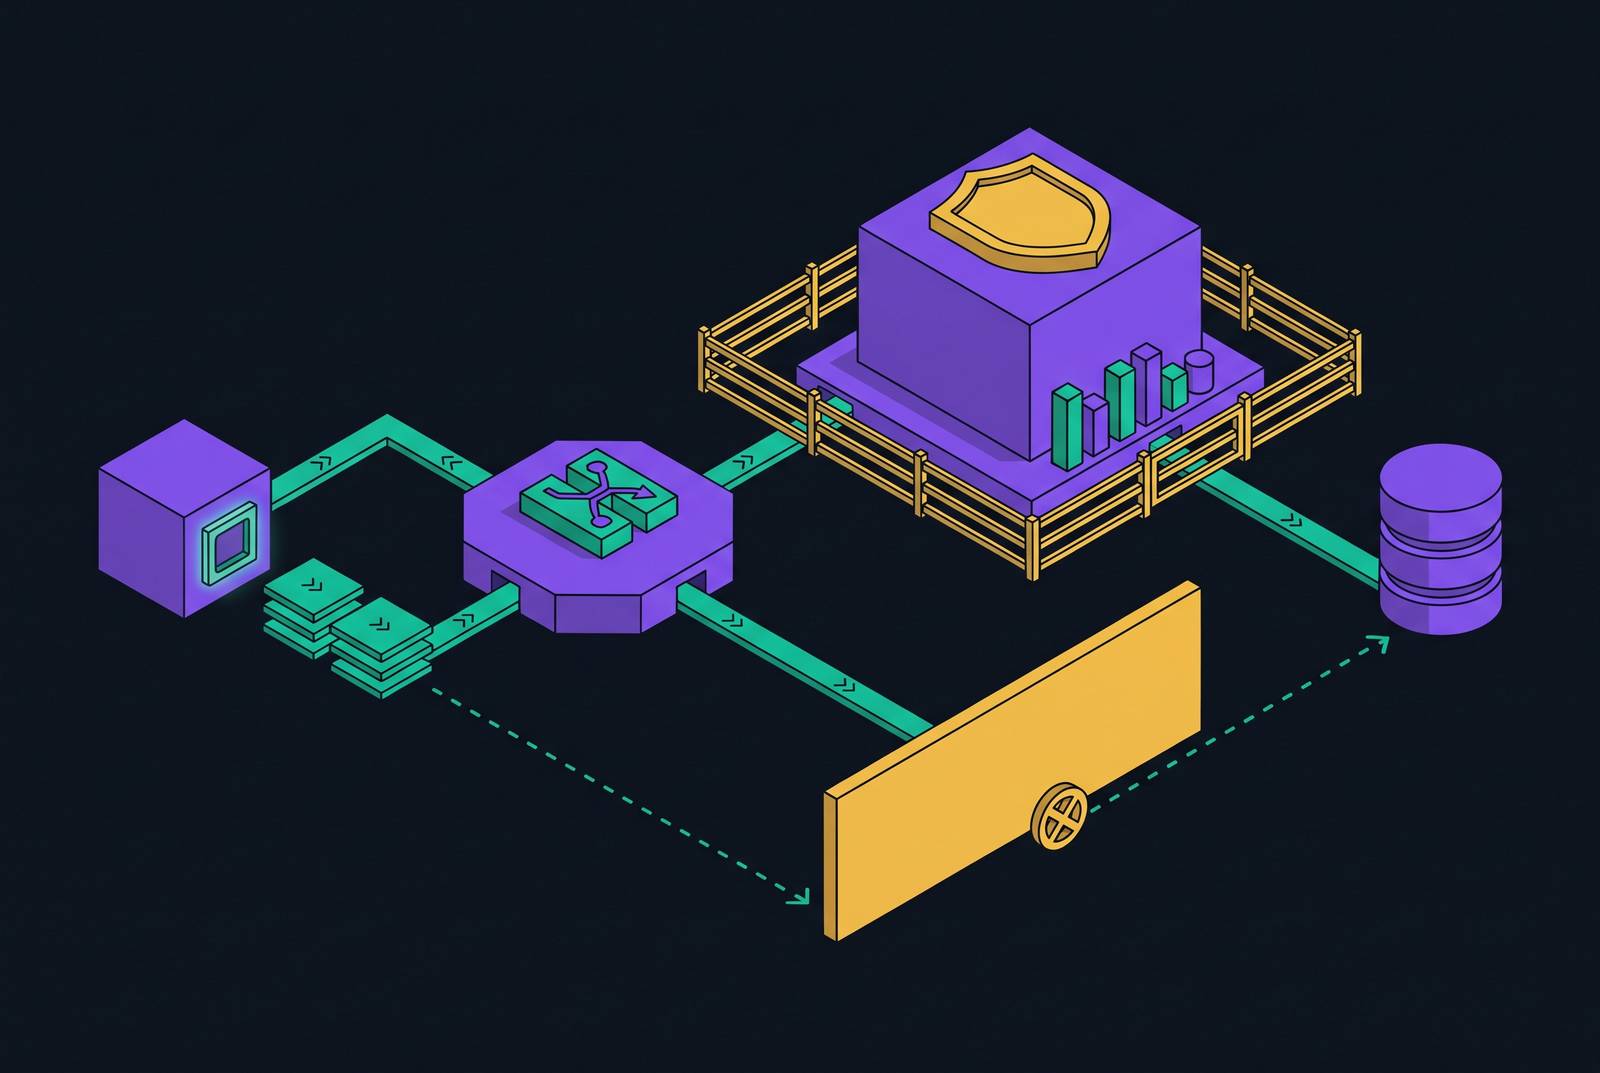
A governed metrics architecture separates the source, the calculation, and the interface. Supabase Postgres remains the operational source of truth. Above it, the metrics layer holds pre-modeled datasets, metric definitions written as code, and pre-calculated results in Parquet files queryable through DuckDB. An MCP server then exposes those datasets as named tools to compatible agents. The agent’s request reaches the tool.
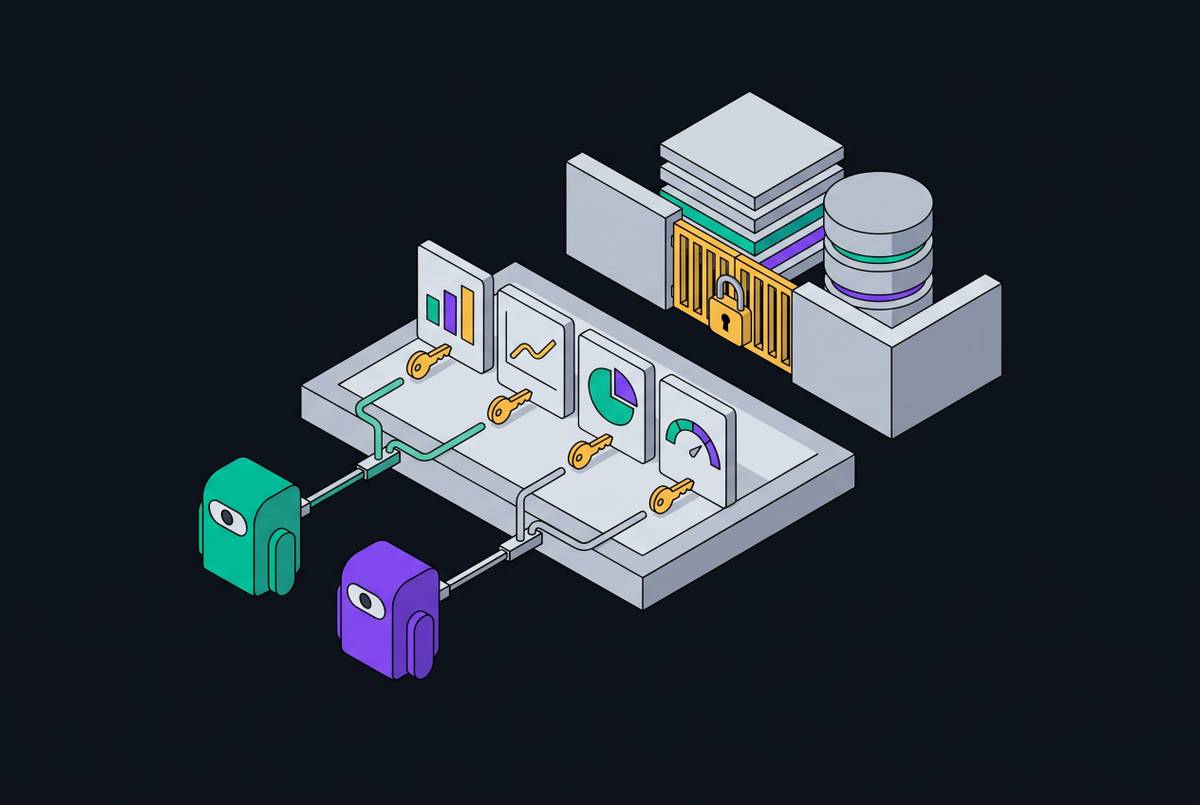
The tool boundary limits what the agent can do. Instead of discovering columns and composing arbitrary SQL, it calls operations such as get_mrr_by_cohort or get_active_users_last_30_days. The calculation lives behind the interface, outside the prompt. The agent can request a result but cannot rewrite its definition, invent another metric, or use that interface to query production directly. Production credentials stay on the server side and never reach the agent.
Pre-calculation keeps repeated analytics work out of live transactional queries, and limits on which tools the agent can call block arbitrary database access. Shared definitions address inconsistent business math. The pattern resembles a headless CMS, which separates content from frontend presentation. Headless analytics applies that separation to metrics so that dashboards and AI tools consume the same definitions.
Microsoft’s announcement of the Microsoft Clarity MCP Server illustrates the interface pattern. An agent can ask, “Show me last week's engagement time by country” and receive structured analytics through Clarity’s Data Export API. It receives aggregates. This is a concrete product example of governed results behind an MCP interface, rather than a recommendation for a Supabase metrics stack. The relevant design choice is that the exposed operation already has an analytical meaning.
Why pre-modeled metrics eliminate the hallucination problem in agent analytics
Consider a request for monthly active users. The database has events and accounts, but its schema may not say whether trial accounts count toward MAU. An agent can write valid SQL that includes them while the product dashboard excludes them. Both calculations can use the same records. The disagreement comes from a missing definition.
That is the specific failure called metric hallucination. The model has not fabricated a database fact, and the SQL may be structurally correct. Instead, it has supplied business logic that the architecture left unspecified. Because the query runs and produces a plausible number, the error is harder to spot than a syntax failure. A confident answer can therefore conceal a disagreement about what was counted.
The same problem applies to ARR, churn, and CAC. Their business definitions may live in a spreadsheet, in someone’s knowledge, or in a BI tool that no longer reflects current decisions. Giving an agent more schema detail may help it navigate relationships, but the choice of business definition still has to come from somewhere. An architecture that leaves that choice to each consumer creates room for divergent answers.
A governed layer makes the definition a schema artifact. MRR becomes version-controlled code applied consistently whether the caller is a dashboard, a Slack bot, or an autonomous agent. The caller no longer supplies the business math. If the team changes whether trial accounts count toward MAU, the definition changes in one place and propagates to downstream consumers rather than requiring separate revisions in every tool.
The resulting guarantee is narrow but important. An agent limited to predefined metric tools cannot generate a calculation that diverges from the governed definition. That eliminates the metric-definition hallucination surface, while other mistakes in an agent’s response remain possible. The team still has to choose the right business definition. Once it does, however, accuracy no longer depends on each caller reconstructing that decision from a natural-language question and a collection of tables.
What MCP observability over a metrics server gives you that direct database logs do not
Named tools also create an operational boundary that can be observed. MCP instrumentation can record call frequency, error rates, and p50/p95/p99 latency for each metric tool. With a record of which agent called which tool and when, a team can examine analytics behavior directly. The unit of observation is the requested metric. That makes the record useful for understanding both demand and failure.
The distinction becomes practical during an investigation. A stale answer raises questions about which tool the agent called and what it received, while unusual call patterns may suggest prompt injection or tool poisoning. Rate-limit errors and malformed data need to be handled in different ways. Tool-level instrumentation can distinguish those signals in the context of the agent’s request, whereas raw query logs do not provide that context in a directly usable form.
Supabase’s documentation describes log drains that send service logs, including Postgres, Auth, Storage, and Edge Functions, to external systems for alerts and dashboards. Supabase also supports agentic connections for monitoring query performance at a regular cadence. Those capabilities address the health of the operational system. The Supabase Metrics API adds Postgres performance and health metrics in Prometheus exposition format. None of these needs to be replaced to observe governed analytics.
The metrics server adds a separate view above that foundation. Database monitoring answers questions about Postgres performance, while MCP instrumentation answers questions about agent analytics behavior. For a small team, the recommended minimum is p50/p95 latency dashboards for tool calls, per-tool error alerts, and a log of the agent, tool, and time of each call. This is a narrow operational scope. It provides much of the useful visibility without turning the architecture into a separate observability project.
How the July 2026 MCP revision pushed session governance onto the metrics server
The MCP revision finalized on July 28, 2026 removed protocol-level session tracking and made the protocol stateless. Each request supplies client identity and capabilities in a _meta parameter rather than relying on context maintained between calls. The official specification states that servers must not rely on prior requests over the same connection to establish that context. Each request must stand on its own. A persistent connection therefore does not substitute for application-level governance.
That change makes the metrics server responsible for sessions. The layer above the protocol has to track which agent made a request, enforce per-session rate limits, and keep context across a multi-step analytics conversation. The distinction is between transport state and application state. A stateless protocol does not prevent a server from maintaining the context its analytics service needs.
Pre-calculation fits this division of responsibility. A metrics server can hold cached results and answer repeated requests without sending the same aggregation back to production Postgres. Direct database access alone has no way to govern sessions like this. Without an intervening application layer, each request becomes another query against live data rather than an operation managed within an analytics conversation.
The latency objection is therefore incomplete. An extra service adds an architectural component, but it does not necessarily add more time to the answer. For common requests with pre-computed results, the costly calculation is already done, so the metrics server can answer faster than a live database query. Stateless transport does not require repeated computation.
What this architecture looks like for a small team running on Supabase without a dedicated data engineer
A pre-Series A team without a dedicated data engineer often has enough data, but first needs to deal with data that does not agree. The product dashboard, investor report, and growth spreadsheet can each assign a different meaning to monthly active users. Agents would carry that disagreement into the work they automate. A governed metrics layer establishes a shared source of business meaning before additional consumers make reconciliation harder.
The practical stack leaves Supabase Postgres as the operational database, without schema changes or an ETL setup. The metrics layer reads from Postgres, pre-calculates MRR, MAU, churn, and CAC, and serves governed Parquet datasets queryable through DuckDB. A single MCP server exposes those datasets as named tools. Human dashboards and agent workflows then use the same metric interface. This keeps the access pattern independent of who asks the question.
The required discipline is narrow but non-negotiable. The team should choose one definition for each metric, write it once as code, and refuse to let individual tools or agents redefine it. That restriction means declining some ad-hoc calculations through the governed interface. The trade-off is deliberate, because resolving a definition once is less painful than reconciling divergent numbers before a board meeting.
For a team evaluating an MCP server, the selection criteria follow from those requirements. It needs predefined metric tools rather than arbitrary SQL, server-side production credentials, governed definitions, and visibility into agent calls. Row-level access controls remain important, but they are not a substitute for those properties. When agents later produce automated reports, answer investor questions, or flag anomalies, they can connect to the governed layer already in place without changing the access architecture. The team has already decided what an analytics answer means before giving an agent permission to retrieve it.