Treating Supabase Metric Definitions as Code That Deploys to Every Consumer
Store metric definitions in Git so dashboards and AI agents inherit the same calculation.
For Supabase SaaS teams that need full API control without an opinionated frontend, the right architecture is a headless, governed metrics layer. Its definitions live in code and deploy to dashboards, AI agents, and reports through a shared analytical backend. The essential contract is one versioned calculation for each named metric, inherited by every consumer.
Why metric definitions drift across a Supabase-backed product
A dashboard shows one number for “Revenue,” while an AI agent returns another from the same Supabase project. A finance spreadsheet produces a third. The records need not be different for the answers to disagree, because each consumer can apply a different calculation to the same underlying data. The dashboard uses its own SQL, the agent interprets a prompt, and the spreadsheet embeds another set of assumptions. The shared metric name conceals the disagreement.
This is metric drift, the silent divergence of a KPI’s definition across consumers. Its structural cause is that the executable definition belongs to no shared system, even when a written definition exists in documentation. Each author interprets that description independently, so adding another consumer creates another opportunity for divergence. Better documentation cannot enforce a shared calculation. For a Supabase-backed product, the fix is to store each definition once and make dashboards, reports, and agents inherit it as a system property.
What a metrics layer actually is, and what it is not
A metrics layer is executable code that specifies how raw data becomes a business metric. It holds the calculation for downstream consumers to use, so each consumer can use it without turning a description into SQL. A glossary cannot perform that work. Neither can a wiki, a catalog entry, or a dashboard filter saved under a shared name. Those tools can explain meaning, but they do not make separate implementations agree.
Improvado describes the metrics layer as the framework that centralizes KPI logic across systems, dashboards, and analyses. With business logic held in that shared layer, a definition changes in one place and propagates to downstream consumers. An agent can therefore consume the governed calculation instead of deriving its meaning from scattered documentation. The boundary still needs to be explicit. Metrics as code can validate structure and internal consistency, but it does not automatically prove that an independently implemented BI calculation conforms to the definition. The guarantee depends on consumers actually using the shared layer.
Why putting metric definitions in Git turns them into enforceable contracts
Git makes a metric definition a versioned engineering object rather than an editable description with an uncertain history. A proposed change appears as a diff in a pull request, where reviewers can see what changed and the review record identifies who changed it and when. More importantly, the reviewed object is the definition that charts and agents consume.
The contract comes from combining that review process with a shared execution path. Git alone cannot prevent a dashboard author from writing unrelated SQL, but consumers that resolve a metric through the governed layer do not maintain independent copies of its calculation. A new dashboard panel, an AI agent prompt, and an Edge Function report all resolve the same name to the same pre-validated calculation.
The one definition that does not survive organizational reality
Sales counts a deal as “closed” at signature, while Finance counts revenue at recognition, which can happen weeks later. Both numbers can be correct because they answer different questions. The conflict can be a naming error that treats distinct business events as interchangeable. No amount of YAML can collapse that distinction without choosing one question over the other.
The mature version of a single source of truth therefore starts with one authoritative foundation of measures, filters, and dimensions that can support multiple valid metrics, provided each has a clear name and use case. Improvado distinguishes centralized data from agreement about definitions and ownership. A warehouse can hold the records without settling what the organization means by revenue. Metrics as code spells out that agreement by giving each valid version its own named, versioned definition. The contract prohibits accidental divergence.
How the same governed definition deploys simultaneously to dashboards and AI agents
A governed definition reaches consumers as pre-calculated outputs that are put in a shared analytical layer. Dashboards and agents read those outputs rather than constructing separate SQL against production Postgres. This is the practical basis for API-first analytics without a required dashboard UI. The interface can change without changing the calculation. For an agent, that removes the need to reconstruct a metric’s meaning from documentation or assumptions treated as obvious.
The Model Context Protocol provides a delivery mechanism for agent access, but it does not clean, transform, or govern the data it exposes. The analytical layer does that work upstream. The protocol’s July 28, 2026 specification added a stateless protocol core, so any request can reach any server instance without protocol-level sticky routing. That simplifies horizontal deployment without defining what “Revenue” means. Informatica announced native MCP support across its Intelligent Data Management Cloud at Informatica World 2026, with servers live or in preview across AWS, Microsoft Foundry, Databricks Agent Bricks, Snowflake Cortex AI, and Salesforce Agentforce. With deployments like these, enterprises come to expect governed agent access, while the definition store stays separate from the delivery server.
Why agents must never query production Postgres directly for metrics
Direct, unguarded agent queries against production Postgres combine security exposure with query load that can interfere with live traffic. They also bypass the modeling that makes business calculations consistent. An agent can still construct an expensive query or produce a plausible answer using the wrong definition. The U.S. National Security Agency’s May 2026 Cybersecurity Information Sheet warned that MCP’s rapid proliferation had outpaced development of its security model.
The Postgres enforcement pattern uses row-level security to limit a request to the rows that the user it runs for can access. With a deny-by-default policy design, a request gets no access if it lacks tenant context. Role choice remains a critical exception, however. Superusers and roles with BYPASSRLS always bypass row security, and table owners do too unless the table uses ALTER TABLE … FORCE ROW LEVEL SECURITY. Agents query governed Parquet datasets through DuckDB instead, removing their analytical query load from live Postgres and avoiding its RLS bypass path for those queries. The governed layer must still control who can access the exported datasets.
What Supabase's native observability layer exposes and where it stops
Supabase provides infrastructure observability for keeping a project healthy. Its observability documentation describes query logs through ClickHouse, accessible through MCP, the API, or Explorer, and live Postgres statistics available through the CLI, Explorer, or MCP. Security and performance Advisors complement Studio dashboards for API, Auth, Storage, Realtime, and database signals. With structured agent prompts, agents can use read-only access to check health, security, performance, and resources.
Supabase’s Metrics API emits CPU and memory utilization, disk I/O and WAL statistics, connection pool metrics, and query performance data in Prometheus exposition format. Scraping runs every minute, with compatibility across Grafana Cloud, Datadog, AWS Managed Prometheus, and other backends that support the same metrics query language. Bringing these signals into the wider observability stack lets teams correlate API latency with connection saturation and query regressions with deployment events. In the week of June 1, 2026, analytics (Logflare) and Vector moved from the default docker-compose.yml into an opt-in overlay, which teams using Studio’s Logs Explorer must include.
How governed metrics and infrastructure observability work together rather than compete
Connection saturation and the definition of MRR belong to different layers of the system. Infrastructure observability tracks conditions such as query latency, p95 response times, resource pressure, and replication lag. Business metric governance specifies how a KPI is calculated and which definition its consumers inherit. Neither can substitute for the other. A fast query can give the wrong business number, while a correct calculation can run on an unhealthy system.
Sentry’s distributed tracing for Next.js and Supabase illustrates the operational side through an edge function timeout that cascades into API errors. A trace connects the page load, API route, edge function, and Postgres query, with timing for each span. Supabase Advisors can surface missing RLS policies and index gaps, but they do not connect a slow database query to the frontend action that triggered it. The governed metrics layer addresses a different question by establishing which calculation a dashboard or agent is entitled to call “churn” or “MRR.”
When early Supabase teams should formalize their metric definitions
The right trigger is the second consumer of a KPI. A first dashboard can reasonably begin with a one-off SQL query. Once an agent, another dashboard, or a finance report also needs “Monthly Active Users,” both consumers need a definition they can inherit. Otherwise, the second implementation introduces another place for business logic to drift. Formalization belongs before that duplication becomes routine.
The practical lesson for a small team is to separate ownership of business judgment from the work of building the plumbing. A fractional analytics partner or managed layer can clean up reporting, define core metrics, and establish a working cadence. The team must still own its definitions and what they are meant to be used for. If only a vendor holds the business logic and the knowledge built up over time, the team risks losing them when the relationship ends, so it should plan to bring that core in-house as data becomes central to its work. Shared executable definitions also reduce reliance on the analyst who holds the SQL in their head, making governed self-service possible. Formalizing them early is cheaper than diagnosing drift later, especially after an agent has acted on a wrong number.
What a governed metrics contract looks like for a Supabase team in practice
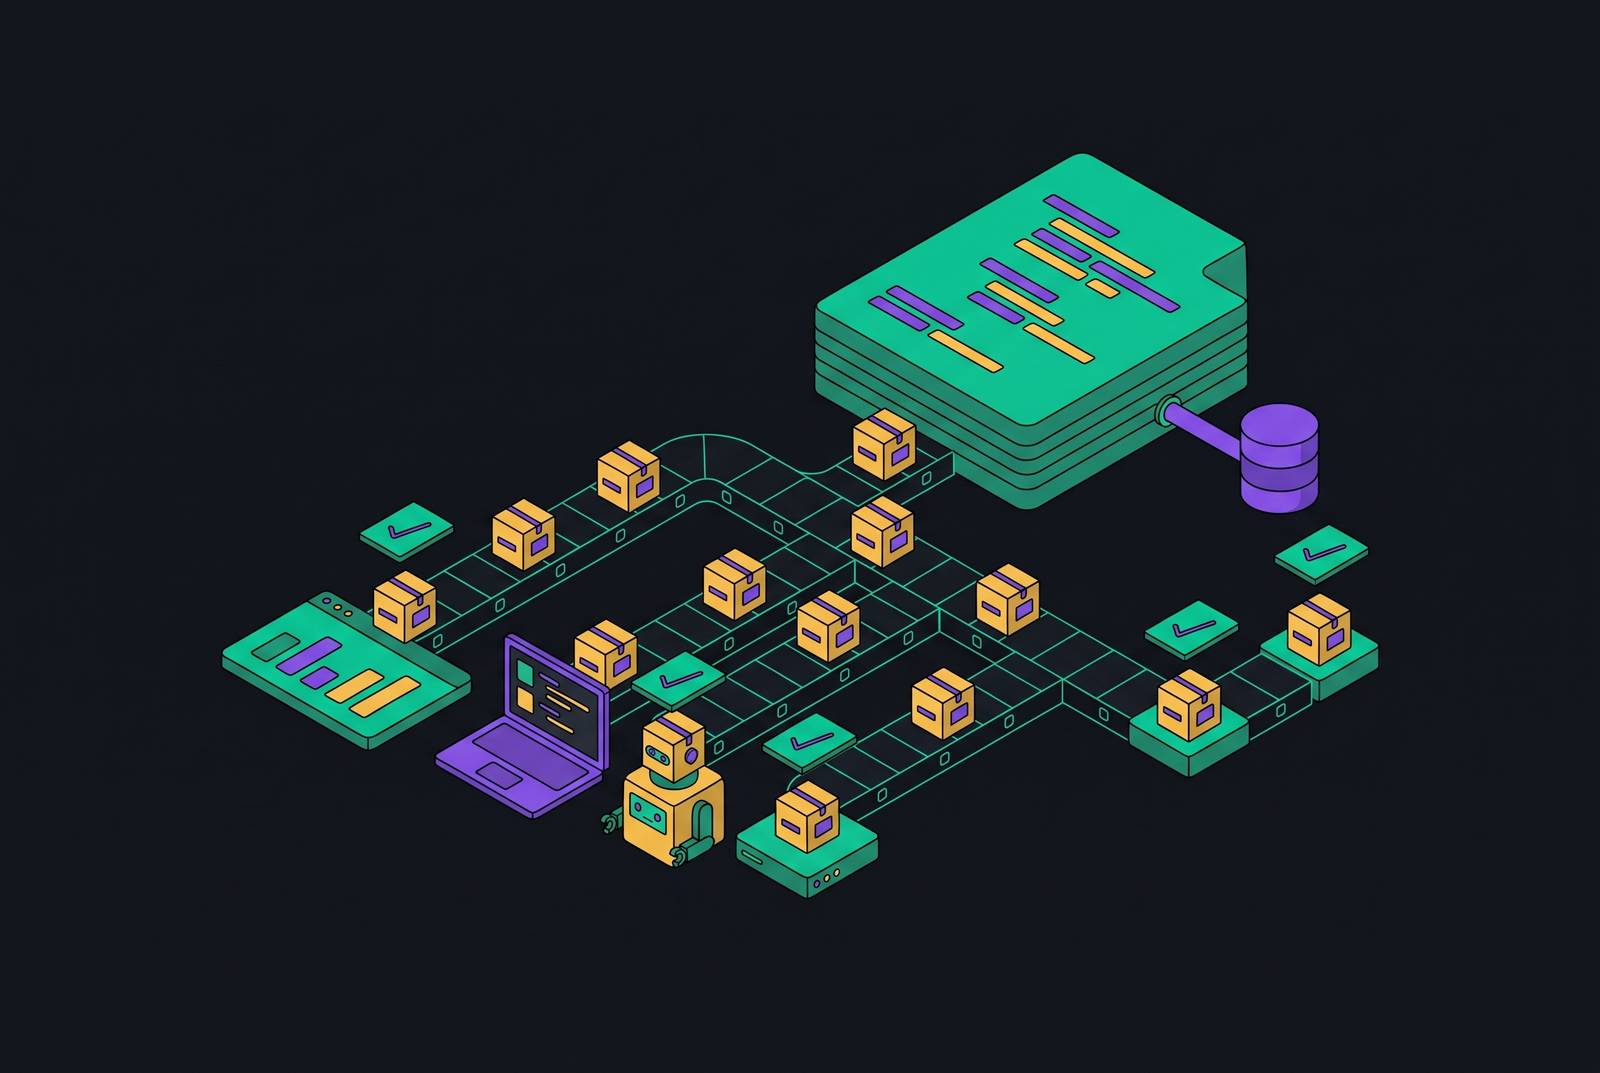
In the implemented pattern, metric definitions live in versioned YAML files in Git and pass schema and semantic checks in CI. Reviewed calculations produce governed Parquet datasets that DuckDB can query. A single MCP server exposes those datasets to agents and API consumers, while dashboards and reports use the same pre-modeled layer. Production Postgres is not the analytical query target.
At the database boundary, analytical tables use RLS policies and FORCE ROW LEVEL SECURITY, but any claim of protection must leave out the superuser and BYPASSRLS exceptions. The Metrics API also sends signals about the infrastructure to the team’s observability stack. A metric change goes through review once, and its updated calculation propagates through the shared layer to a dashboard, an agent, or a Slack report without requiring each consumer to rewrite its logic. Legitimate variants remain separately named.